Is the Efficiency Ratio still efficient?
It’s one facet of a multi-faceted diamond
- |
- Written by Jay Brew

When I facilitate strategic retreats, directors continually ask, “What is the efficiency ratio?”
The efficiency ratio is defined as noninterest expense less amortization of intangible assets, divided by fully taxable equivalent net interest income plus noninterest income.
Typically, one would add to this definition: The lower the ratio, the more efficient the bank. Banks should target a ratio in the mid to low 60s, as this is an industry standard level of efficiency.
One can see that the efficiency ratio includes two of the three components of what Seifried & Brew considers the key drivers of community bank profitability.
• The first is the net interest margin, expressed in taxable equivalent dollars.
• The second is net overhead, the difference between noninterest income and noninterest expense.
The third key driver is missing. Tax efficiency is not included in the efficiency ratio. As with any community banking ratio, the efficiency ratio in itself may not be telling the whole story.
But, as with many community banking ratios, it may be the reason to dig deeper into the puzzle!
Exhibit 1
 For a larger version, click on the image
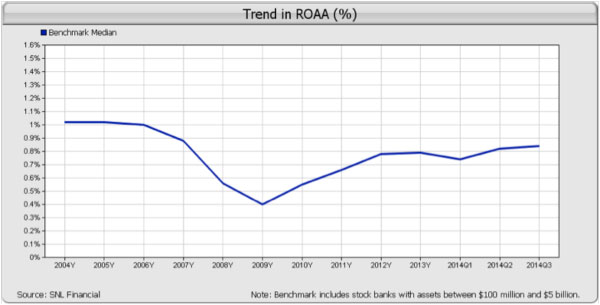
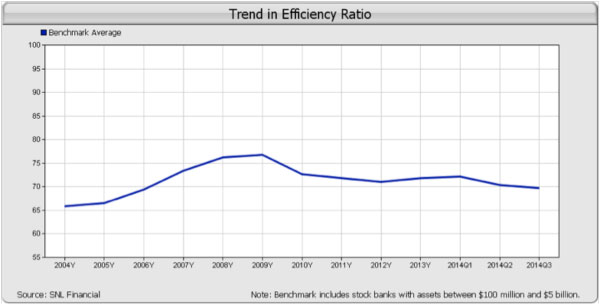
For instance, take the comment that the industry standard for the efficiency ratio is in the mid-to-low 60%s. In fact, the industry average at the 3rd quarter of 2014 is at 70%. Also, as can be seen in the Exhibit 1 above, the industry has not been at the standard for 10 years. What components of the ratio have shifted?
Exhibit 2
 For a larger version, click on the image
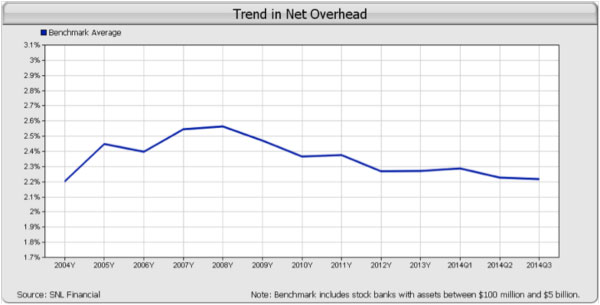
As can been seen in the chart of net overhead, Exhibit 2, net overhead has just gotten back to the point where it was ten years ago. This suggests that net overhead would not be the component that is currently keeping the national benchmark at 70. Even so, the higher levels of net overhead, as a result of higher lending expenses from the Great Recession, did have a negative impact on the efficiency ratio. This would indicate that another trend was occurring.
Exhibit 3
 For a larger version, click on the image
Exhibit 4
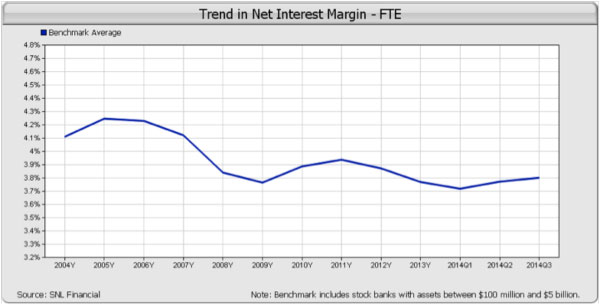
Due to low interest rates on loans, investments, and deposits, the national benchmark has seen a decline in the net interest margin fully taxable equivalent (FTE). While it is difficult to gauge this in terms of fully taxable equivalent dollars, it is apparent that return on average assets (ROAA) would prove that the national benchmark is making less money compared to ten years ago, considering that net overhead is approximately the same.
Immediately this would suggest that the efficiency ratio cannot be fully explained by an individual community bank unless one looked at the trends in what makes up the ratio.
Could it be argued that the industry is less efficient today than ten years ago due to the overall trends in community banking?
Exhibit 5
 For a larger version, click on the image
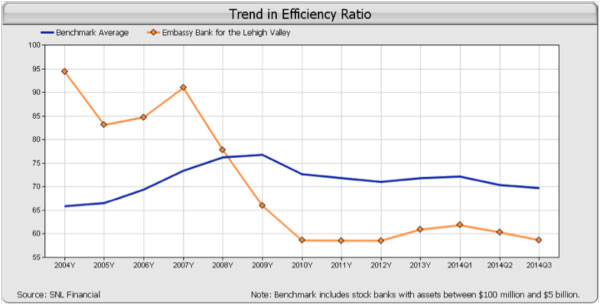
I would argue that there are numerous community banks that have gone against industry trends. Case in point is Bethlehem, Penn.’s Embassy Bank, $717.2 million-assets, where I am a founding director. Embassy’s efficiency ratio is currently at 58.68%.
My argument is why can’t most community banks perform at this level of efficiency? We are all in a similar business.
But the efficiency ratio may be missing a vital part of a community bank’s value. That value is cash type deposits: the sticky relationship accounts of checking, savings, and money market accounts. A community bank strategy to open more and more of these accounts may mean opening branches, hiring customer relationship employees, and marketing campaigns. This could add to higher levels of noninterest expense.
The efficiency ratio would not be kind to this strategy! If a board used the efficiency ratio as its guiding strategy, the bank’s future value may be diminished.
Once again look at the trend in Embassy Bank’s efficiency ratio in Exhibit 5. The bank is about 14 years old.
The chart shows that Embassy’s efficiency ratio was very high in the early years. But the branching, hiring of excellent customer relationship employees, and marketing has paid off.
Embassy has reached a ratio of 87.48% of cash type deposits to total deposits versus 66.61% for the national benchmark. Embassy’s cost of funds is 0.44% versus the national benchmark at 0.51%. But a key component in Embassy’s strategy is that the employees are far more efficient. Embassy’s assets per employee comes in at $10.394 million compared to the national benchmark at $4.786 million.
Overall one could say that Embassy’s strategy has created high performance and a high performing efficiency ratio. This wasn’t luck, it was driven by strategy.
How to make efficiency ratio work for you
Strategic planning should focus on the components of the efficiency ratio. At the core of every strategic plan should be a financial model of the bank’s balance sheet and income statement.
Fully taxable net interest margin in dollars should be projected over the next five to ten years. If management assumes that over the next years that the net interest margin will decline, then a corresponding strategy could be to grow faster. Or if the net interest margin in dollars declines, then net overhead must decline at a faster rate. Or if the bank is not tax efficient, then a tax plan could be initiated to offset other shortfalls.
The model acts as a road map for the future. The board and management team then know what needs to be accomplished. The board, through key ratios, such as the efficiency ratio, can monitor the progress of the plan.
A community bank is like a diamond. One has to analyze its facets to understand the whole. The efficiency ratio is one of those facets. It not only tells part of the story of the diamond, but is also tied to all the other facets.
Tagged under Mergers Acquisitions; Duties; CSuite; Performance; Big Data; Feature; Feature3;
Related items
- Mastering Compliance in a Complex Financial Landscape (With a Proactive Risk Lens)
- Circle’s Bank Charter Application Game Changer in the Banking Industry
- Robinhood Launches Tokenized US Stock Trading for EU Users
- Crypto Holdings Could Be Considered in Mortgage Applications
- Leading Expert From IPE’s Risk Panel Along With CEO Leads Online Discussion on July 22


