


Branches after post-crisis pruning
SNL Report: Office openings and closings by CRA-designation since 2006
- |
- Written by SNL Financial

By Daniel M. Burkard and Tahir Ali, SNL Financial staff writers
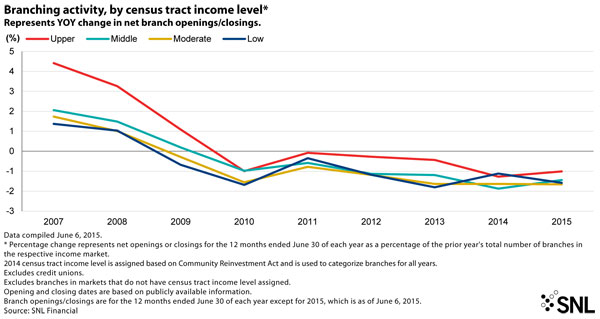
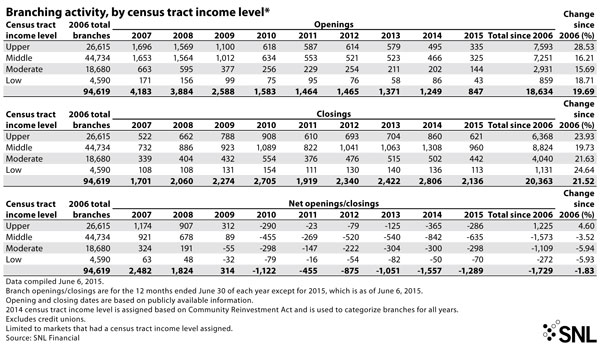
As banks continue to trim branch networks following the credit crisis, the industry's physical footprint has continued to pivot toward wealthier areas. Since 2006, banks and thrifts have added a net 1,225 branches in upper-income census tracts, an increase of 4.60%. Meanwhile, total branches in low-, moderate- and middle-income designated tracts fell between 2006 and 2015 by 5.93%, 5.94%, and 3.52%, respectively.
To conduct this analysis, SNL examined bank and thrift branch openings and closings at the census tract level based on the Community Reinvestment Act income designation for the census tract. The income level designations are based on tract classifications as defined by Home Mortgage Disclosure Act and CRA regulations. A "low-income" census tract has a median family income that is less than 50% of the median family income for the broader area, (the metropolitan area containing the tract or the entire non-metropolitan area of the state). A "moderate-income" census tract has a median family income between 50% and 80% of the broader area, a "middle-income" census tract falls between 80% and 120% and an "upper-income" census tract comes in at 120% or more of the median family income for the broader area.
To make the data comparable from 2006 to 2015, SNL used the 2014 CRA income rating for each census tract.
No segment immune to closures
Over 40% of all branches opened since 2006 have been in upper-income census tracts, compared to just over 20% for the moderate- and low-income tracts combined.
But wealthier areas have not been immune to closures; every year since 2010, banks and thrifts have closed more branches than they have opened in upper-income tracts.
As of June 2015, 76.42% of branches were located in upper- and middle-income areas, while 23.58% of branches were located in low- and moderate-income areas. At the end of June 2006, 75.41% of branches were in upper- and middle-income areas, while just fewer than 25% were in low- and moderate-income areas.
 Click to enlarge image
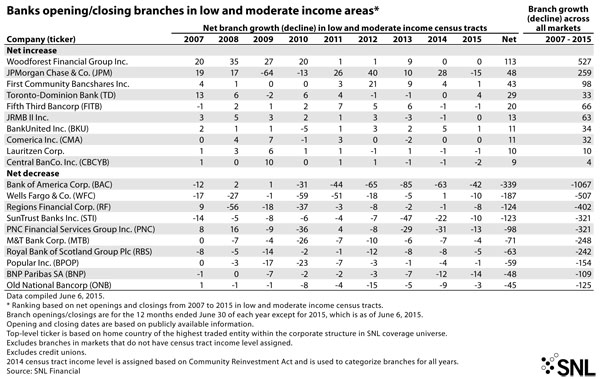
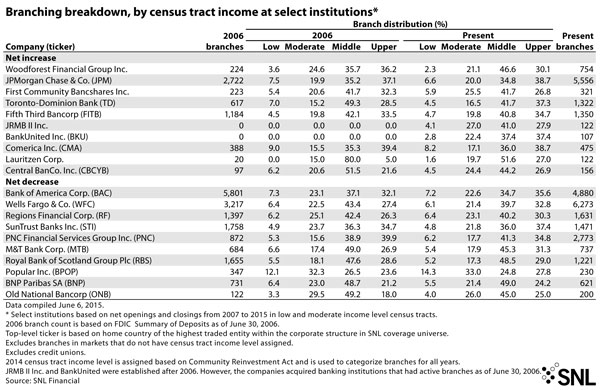
Since 2006, Bank of America Corp. has closed a net 339 branches in low- and moderate-income census tracts, the most of any bank or thrift in the country. However, the bank also cut 728 branches in middle- and upper-income markets over the same time frame. In June 2015, 29.8% of Bank of America's branches were located in low- and moderate-income census tracts, down slightly from the 30.4% representation in June 2006.
Despite closing a net 59 branches in low- and moderate-income tracts, as of June 2015, Popular Inc. had 47.3% of its entire branch footprint in these lower-income areas, the most among any of the top 10 net closers. By comparison, Popular had 44.4% of its branches in low- and moderate-income tracts in June 2006.
 Click to enlarge image
Patterns among net openers
On the other side of the spectrum, Woodforest Financial Group Inc. opened a net 113 branches in low- and moderate-income areas since 2006, the most of any bank or thrift in the country. Even so, this only accounted for 20% of the bank's total net openings during that time period and the proportion of Woodforest's branch network in low- and moderate-income tracts fell to 23.4% from 28.2% over the same time frame.
Twenty-nine of the 33 net openings at Toronto-Dominion Bank since June 30, 2006, were in low- and moderate-income tracts. However, in June 2015, the bank only has 21% of its total branch footprint in these markets, compared to 22.2% in June 2006.
 Click to enlarge image

Tagged under Financial Trends; Tokenization; Compliance; Channels; Fair Lending;

Related items
- “Stablecoin Strategy” Is a 2026 Question for Banks, Not a 2027 One
- Tokenization Could Reshape Financial Markets, Says IMF
- Bank of England Warns AI Agents Could Need New Rules
- Securitize Set for NYSE Debut Following SPAC Merger Approval
- US Banks Raise Shareholder Payouts After Passing Fed Stress Tests