What’s happening to fee income?
Nothing happens in a vacuum. Relationship pricing and stashing cash change revenue mix
- |
- Written by Mike Moebs
- |
- Comments: DISQUS_COMMENTS
 Pricing and fee income prove to be a complicated three-dimensional puzzle, but Prairie Economist Mike Moebs has some solutions to the cube.
After a significant drop during the Great Recession in 2008, net interest margin has returned to pre-recession levels at 2.63% of assets, where it was in 2006. In the same time period, the Fed funds rate has decreased from 5.17% in 2006 to 0.82% for the first quarter of 2017.
By now financial services executives have learned that Janet Yellen and the Fed really control net-interest margin, not the marketplace.
Financial institutions have two areas of bottom-line control: expenses and fee revenue.
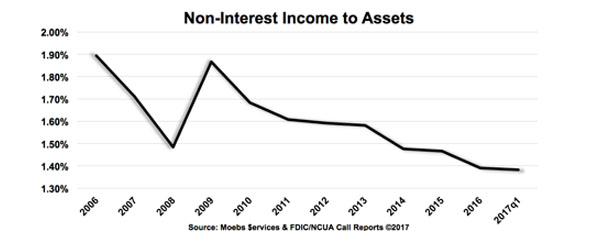
Since 2006, both non-interest expenses and non-interest income have fallen. Expenses have dropped a total of 7.1% to 2.56% for the first quarter of 2017; non-interest income fell 27.1% to 1.38% for the first quarter of 2017 (Chart 1).
Chart 1
Why things look this way
Oh, why can’t the reverse be true, with a big fall in expense instead of fee revenue?
Transaction interchange for all depositories has consistently been increasing. At the same time, the large financial institutions have grown merger and acquisition fees, wealth management charges, along with trading desk fees. However, these are not sufficient to offset the reductions in loan fees and service charges on deposit accounts that have been seen.
Last month’s Prairie Economist, “Are you watching banking’s barometer?” dealt with the stashing of cash as seen through the Checking Account Balance Barometer.
How will the Checking Barometer match up with non-interest income, more specifically the service charges on deposits, and the effects of relationship pricing strategies? Let’s see.
Economic effects on service charge income
Non-Interest Income is made up of many components. However, there are a few major components making up a large share of the total. They include:
• Service charges on deposit accounts
• Interchange
• Loan fees
• Merger and acquisition payments
• Wealth management charges
• Trading desk fees
Service charge income is the most visible component of non-interest income. This is made up of fees for overdrafts, monthly maintenance, ATM withdrawals, money orders, check cashing, and a few more. Many consumers and small businesses take advantage of these services offered by banks and credit unions, and are affected by their pricing.
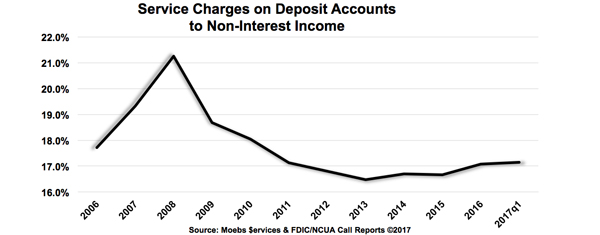
Service charges only make up 17.1% of total non-interest income (Chart 2). Service charges hit a high in 2008, making up 21.3% of total non-interest income. This fell to a low of 16.5% in 2013, until picking up again to pre-recession numbers.
Chart 2
How downshift happened
Financial service pricing is unique. You can pay for financial services with rates, fees, or deposit balances. The practice of using compensating balances to reduce fees and raise yields in services and commercial loans dates back to the Medici banks in the fourteenth and fifteenth centuries.
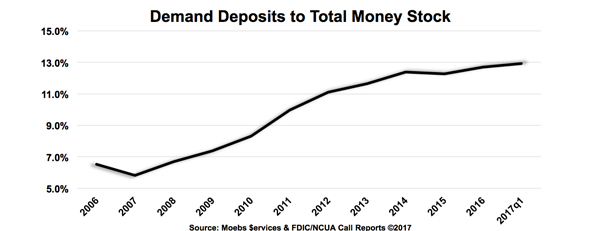
Demand deposit account (DDA) balances as a percent of all deposit balances have grown from a norm of about 6.5% in 2006 to where they are currently at 12.9% of total deposit balances (Chart 3).
Chart 3
Higher sums being hoarded in DDA has a direct effect on the amount of service charges collected by depositories. Consumers can use those balances to pay for fees. DDA balances have also reduced loan fees because of compensating balances, as well as affected wealth management charges and other fee categories.
Relationship pricing reduces fees
If a financial institution can sell two or more services this can increase profitability. If this can be done with one of the services as a loss leader, such as checking sold with a home equity loan, then the overall relationship can be positive for the consumer or small business as well as the depository.
Building a relationship can be difficult. Cost is increased for the financial institution trying to sell two or more services to one account holder.
There are fewer consumers with two or more services at one institution. Cross-selling with skilled sales people thus becomes very important. Labor costs in sales and information technology costs for compiling valuable consumer data are the two main costs with cross-selling and building service relationships.
Consumers’ balancing act
The marketplace has commoditized many deposit and loan services because information is readily available to buyers on their mobile devices. Typically, a consumer may have three different financial institutions—one each for checking, another for a mortgage, and a third for an auto loan.
Some consumers and small businesses have learned to use the cash they have stashed in checking to reduce fees. So, instead of three potential financial institutions serving each of the three services sought, buyers can put all services with one institution using balances as a way to get the price for fees or rates reduced, or in some cases have fees eliminated completely.
Thus, while relationship pricing can be more profitable by creating multiple relationships, the ultimate risk is a loss of fee revenue when deposits are plentiful to buyers.
Risk of fee revenue— especially service charges
Service charges make up $43.6 billion for all depositories currently. Banks represent the majority with 79.5%, credit unions represent 18.2%, and thrifts only represent 2.3% of total service charges.
Absolute numbers do not tell the real story of non-interest income, especially service charges on deposits. Relating fees to assets gives keen insight into the true story of fees, especially service charges.
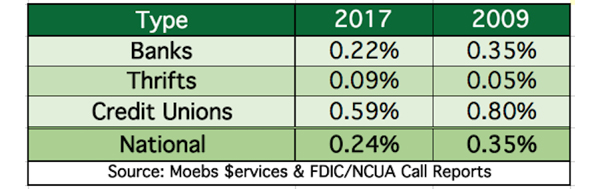
Since the peak of service charges in 2009, banks have lost 37.1% of their service charge revenue. Credit unions have lost 26.3% of their service charges. Thrifts began at a low base with service charges only at 0.05% of assets, but they have managed to almost doubled since 2009 (Chart 4).
Chart 4: Service Charges to Assets
When comparing how each type of depository ranks when looking at how much of non-interest income is made up of service charges, credit unions are the clear winner. Their service charges make up nearly half, or 47.6%, of non-interest income. Whereas, for banks only 15.7% of non-interest income is made up of service charges. The share comes in even lower for thrifts: 6.4%.
An even more important comparison is to relate service charges to net income. Credit unions’ service charges represent 83.6% of total net income. For banks and thrifts this ratio is much lower at 21.4% and 8.1%, respectively.
Banks charging more than credit unions is a myth when compared on a relative basis of service charges to total non-interest income or net income. Service charge income becomes an organizational risk if it starts to dominate the bottom line.
How can you increase non-interest income?
Service charges give insight into how total non-interest income can be structured to: promote the use of fees, yet appear consumer or buyer friendly, while increasing the bottom line:
1. Increase the fee.
Any labor-intensive service in most financial institutions usually needs a price increase. This ranges from official checks to wealth management services. With much of pricing, if cost exceeds benefits to the institution, then raise the price.
2. Volume can be used to increase revenue.
If a fee is priced too high for transaction services, then use of the service will decline. This is often seen with overdraft prices—reducing the price will generally increase volume and total revenue.
3. Package similar fees into one overall price.
Sometimes feeing can become too prolific—no one likes the feeling of being “nickeled and dimed.” For example, loans are often seen by many borrowers to come with lots of small fees. In these cases, package all those small fees into a single one-time fee. The result is less friction with the borrower and equal or greater revenue.
4. Recognize the value of balances.
Often the price in terms of rates is so small it actually reduces value for the service. Balances can sometimes reduce prices if the balances brought by the account holder are significant. The value lies in lower funding cost which can exceed the fee revenue earned.
5. Consider using balances in a reward program.
The initial impact will be to reduce fee revenue but you’ll see an increase in the bottom line, with the result being lower funding cost and greater value to the consumer.
Semper,
Mike Moebs
(Mike will respond to questions at [email protected])
Tagged under Bank Performance, Management, Lines of Business, Blogs, Community Banking, Fee Income, The Prairie Economist, Feature, Feature3,